Appearance
CRM Contact Reports
FluentCRM provides a comprehensive Reports dashboard specifically for contact analytics. This section offers a high-level view of your database health, geographic distribution, and growth trends, enabling you to make data-driven decisions for your marketing strategy.
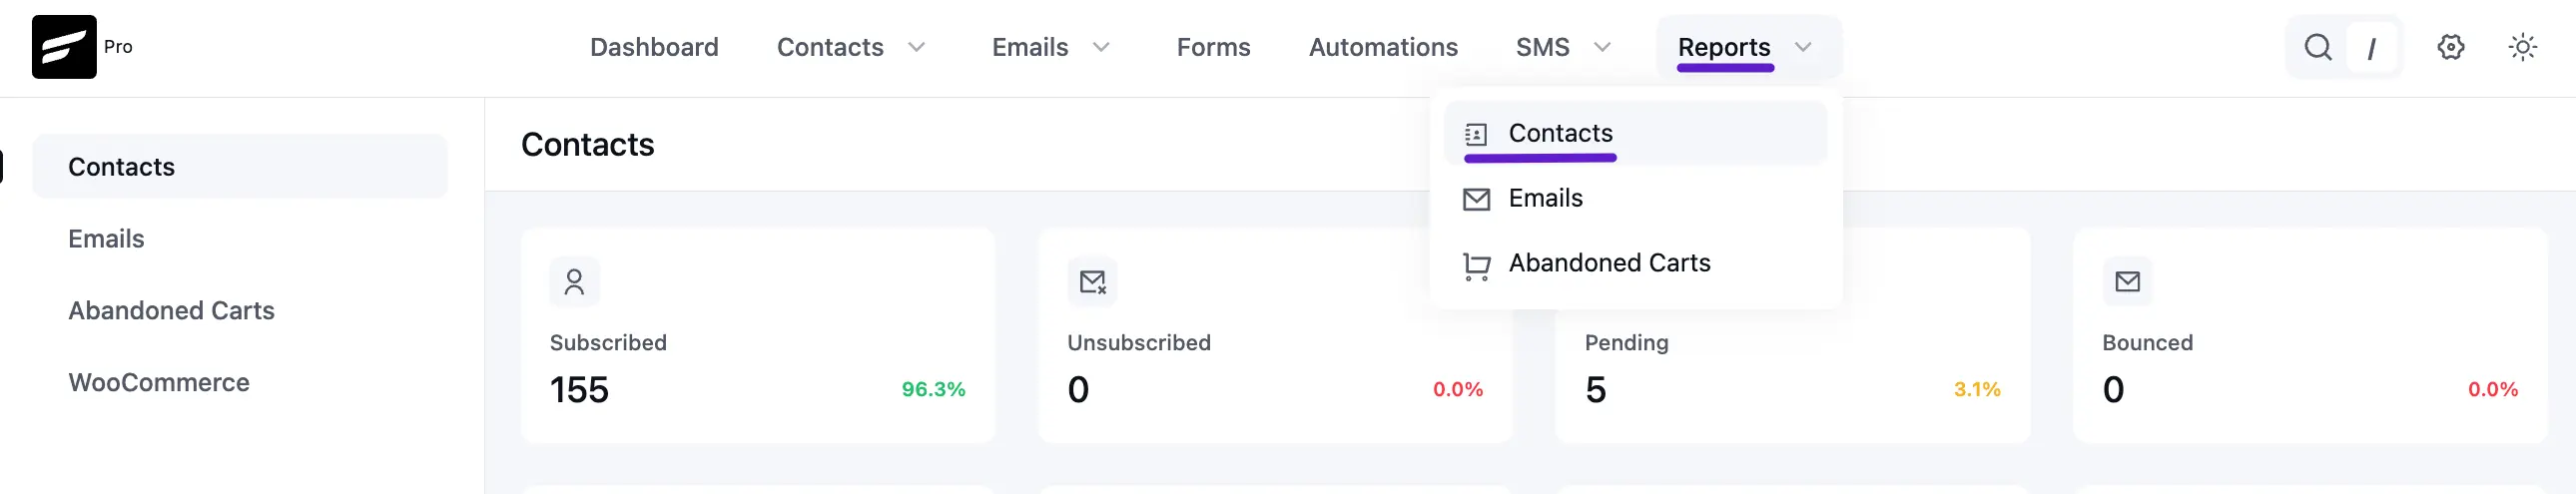
To access these reports, navigate to the Reports dropdown in the top navbar and select Contacts.
1. Contact Status Overview
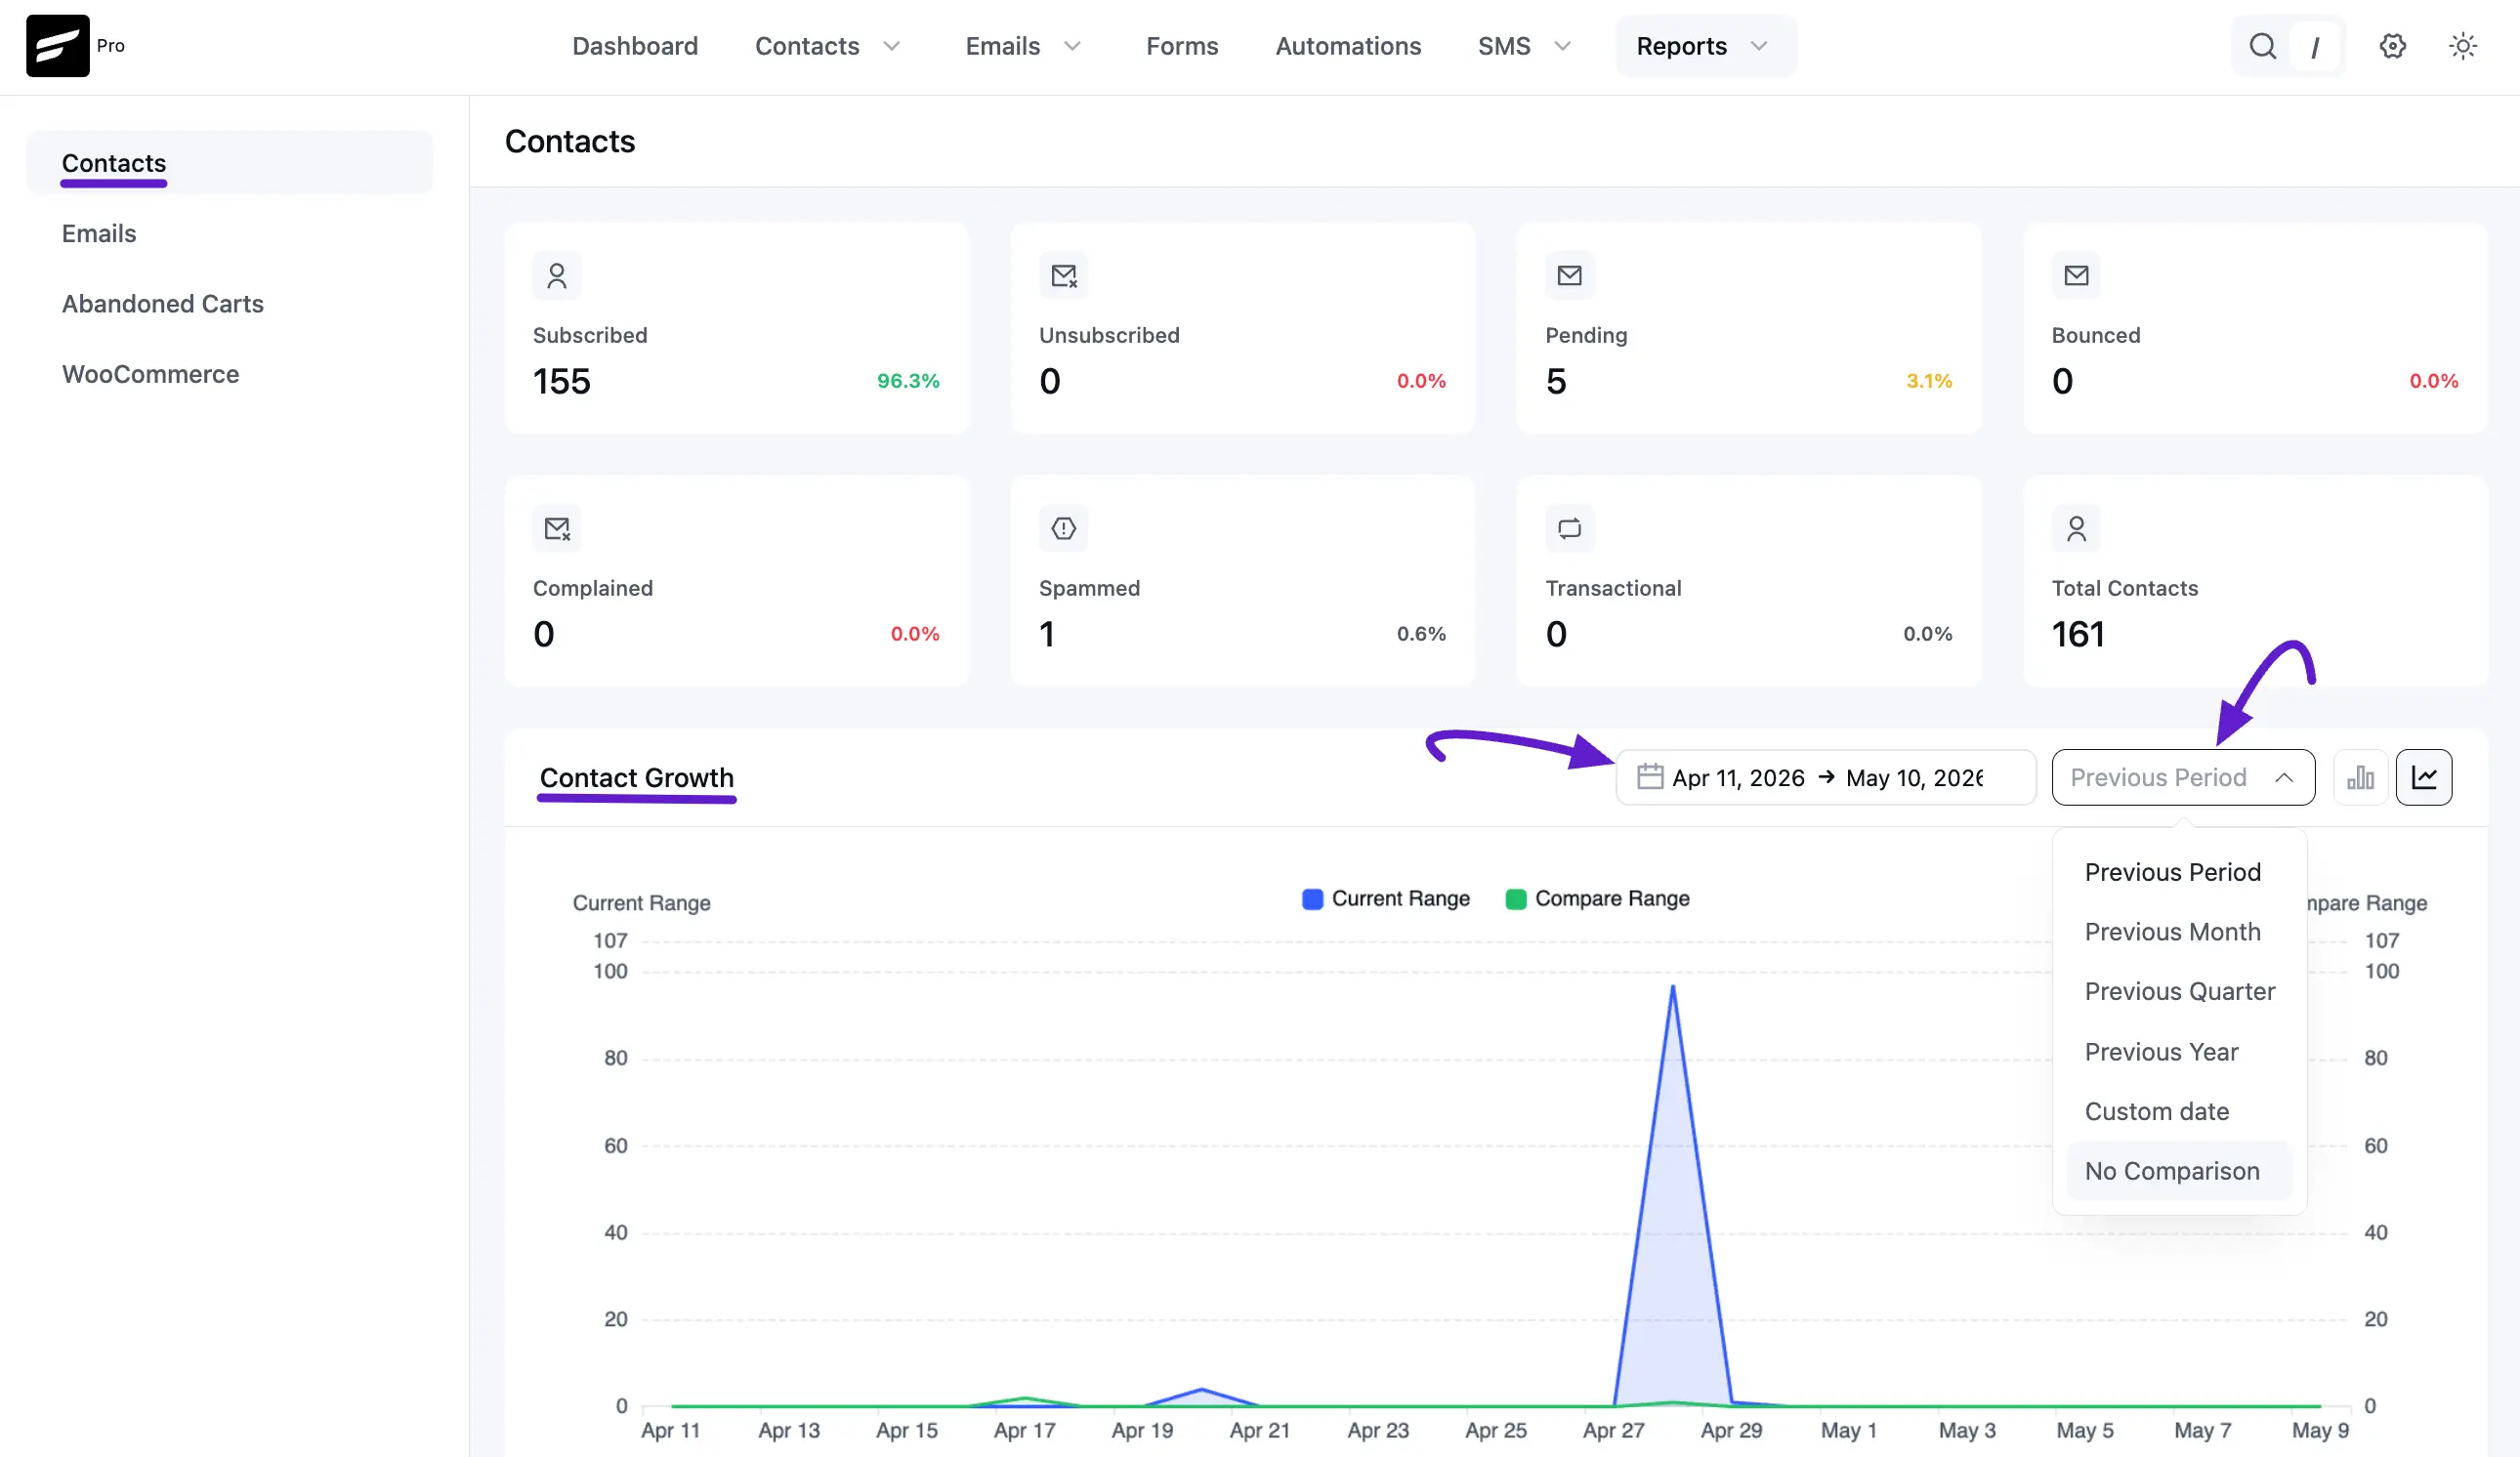
The top section of the dashboard features a set of cards providing a real-time count and percentage breakdown of your contact statuses. This is essential for monitoring list health at a glance.
- Subscribed: Your active marketing audience.
- Unsubscribed: Contacts who have opted out.
- Pending: Contacts awaiting Double Opt-in confirmation.
- Bounced: Invalid email addresses identified by your provider.
- Complained: Contacts who flagged your emails as spam.
- Spammed: Manually or automatically identified junk data.
- Transactional: Contacts receiving only functional/order-related emails.
- Total Contacts: The aggregate number of unique profiles in your CRM.
2. Contact Growth Chart
This interactive line graph tracks how your database expands over time.
- Date Filtering: You can select a specific date range (e.g., Mar 1, 2026, to May 11, 2026) to analyze growth.
- Comparison Mode: Compare your current growth against a "Previous Period" to identify seasonal trends or the success of specific lead-generation campaigns.
- Data Visualization: The chart highlights the Current Range (Blue) and Compare Range (Green) to provide a clear visual contrast of performance.
3. Contacts by Country (Geographic Heatmap)
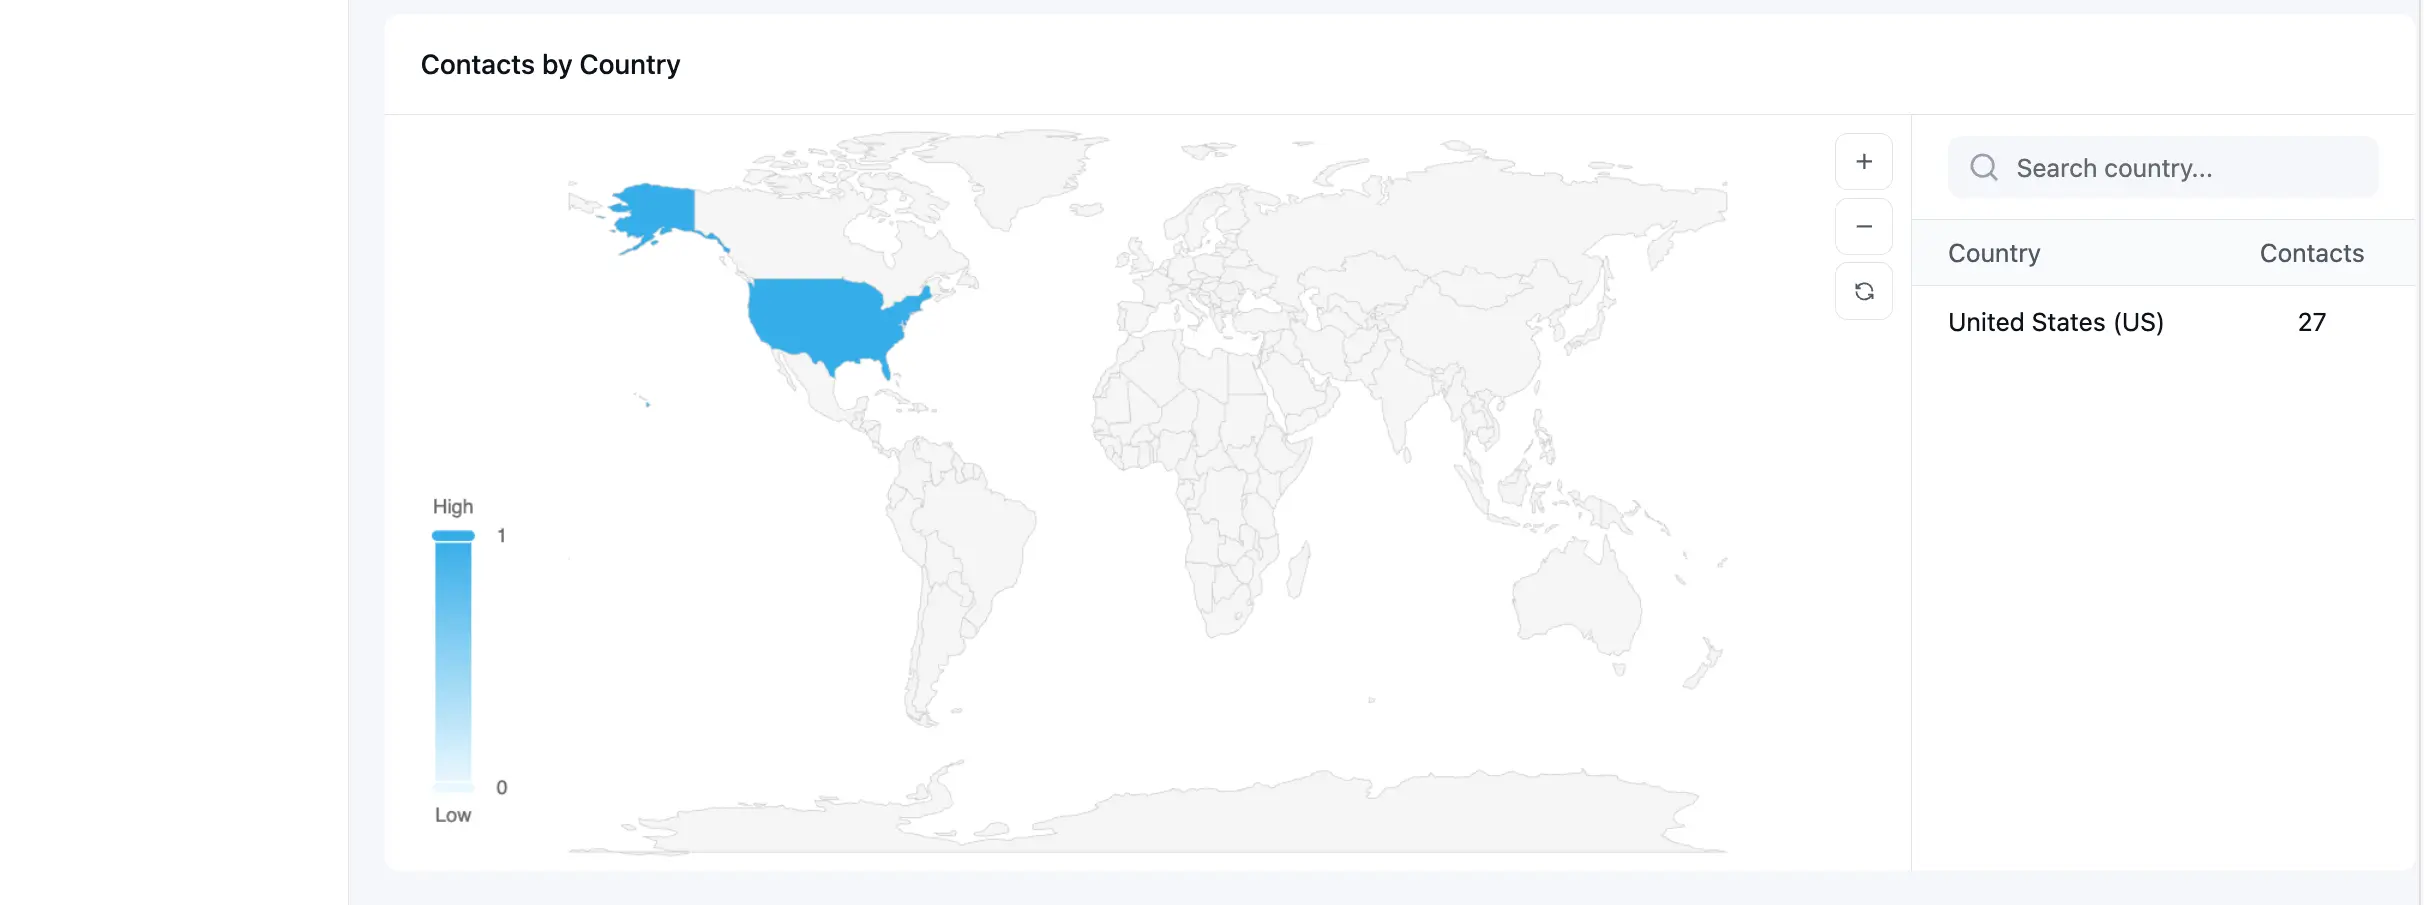
This section helps you understand where your audience is located globally.
- Interactive Map: A world map highlights countries based on contact density. Higher density areas appear in darker shades of blue.
- Search and Table: On the right side, a searchable table lists specific countries and the exact number of contacts residing there (e.g., United States - 1).
4. Targeted Growth Analysis
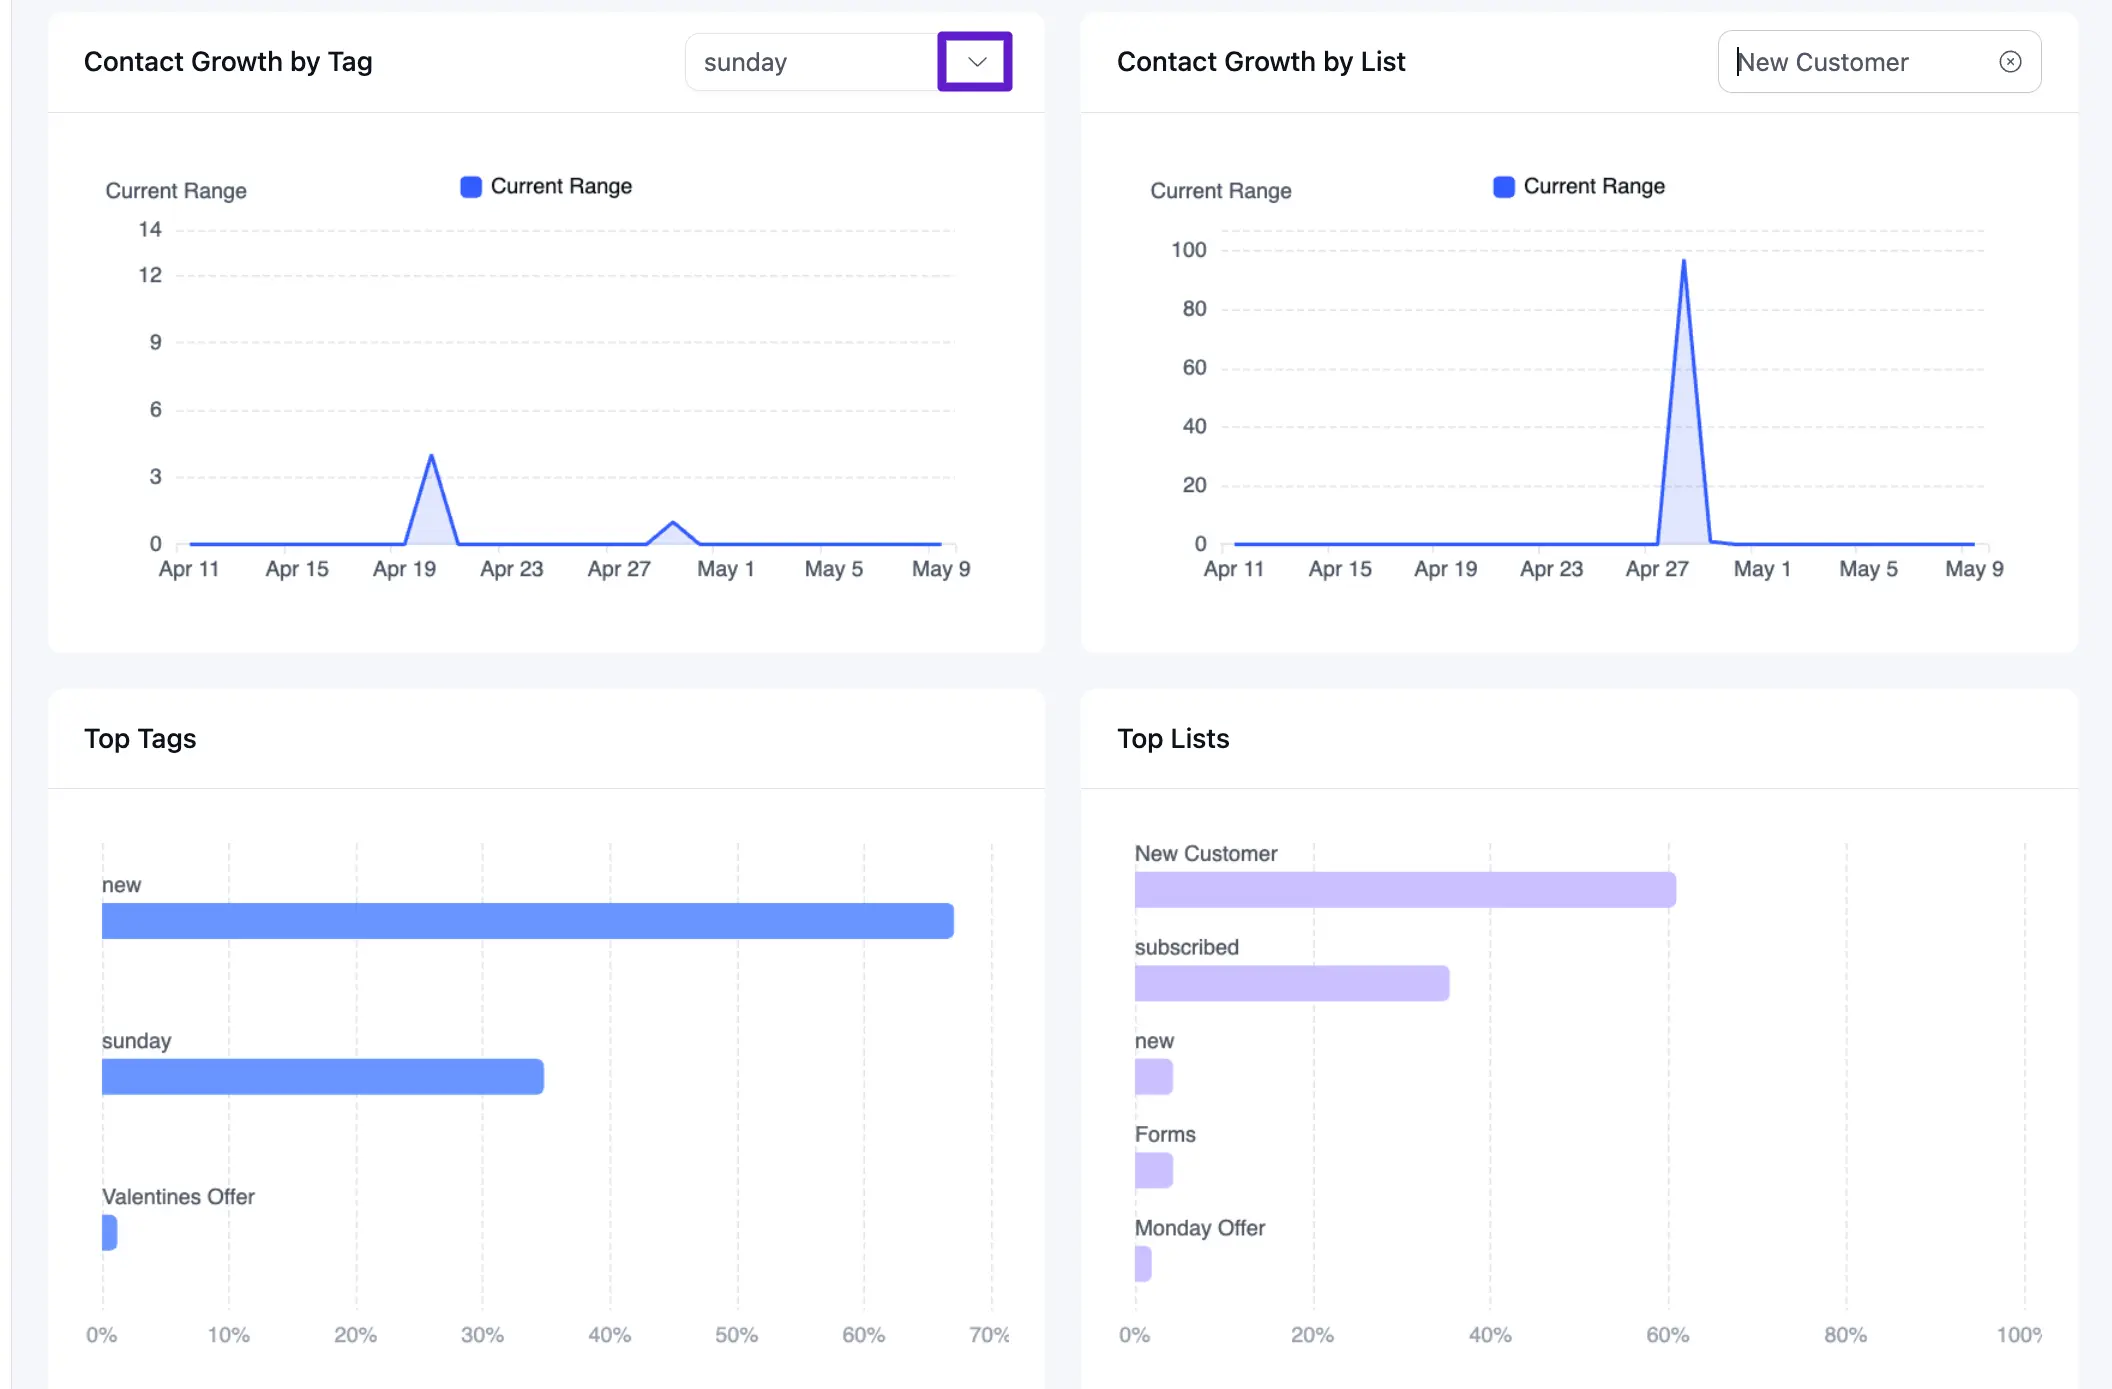
FluentCRM allows you to dive deeper into growth patterns based on your internal labeling system.
- Contact Growth by Tag: Use the dropdown menu to select a specific tag (e.g., new, sunday, or Valentines Offer) to see how that specific segment has grown over time.
- Contact Growth by List: Select a specific list (e.g., Forms, subscribed, or test) to view the acquisition rate for that particular subscription group.
5. Top Labels Analytics
The bottom section of the report visualizes your most effective segments through horizontal bar charts.
- Top Tags: Displays your most frequently used tags and their relative distribution across the database. This helps identify your largest customer interests or behaviors (e.g., the new tag representing over 60% of the sample).
- Top Lists: Shows which subscription lists are the most popular (e.g., New Customer, subscribed). This is vital for understanding which entry points are driving the most traffic to your CRM.
Best Practices for Contact Reporting
- Monitor Bounce Rates: If your Bounced or Complained cards show sudden increases, review your email content and sending provider settings immediately.
- Analyze Tag Growth: Use the Contact Growth by Tag feature after running a specific promotion to see exactly how many new leads that campaign generated.
- Geographic Targeting: Use the Contacts by Country map to determine if you should localize your email sending times for specific time zones.