Appearance
The FluentCRM Dashboard
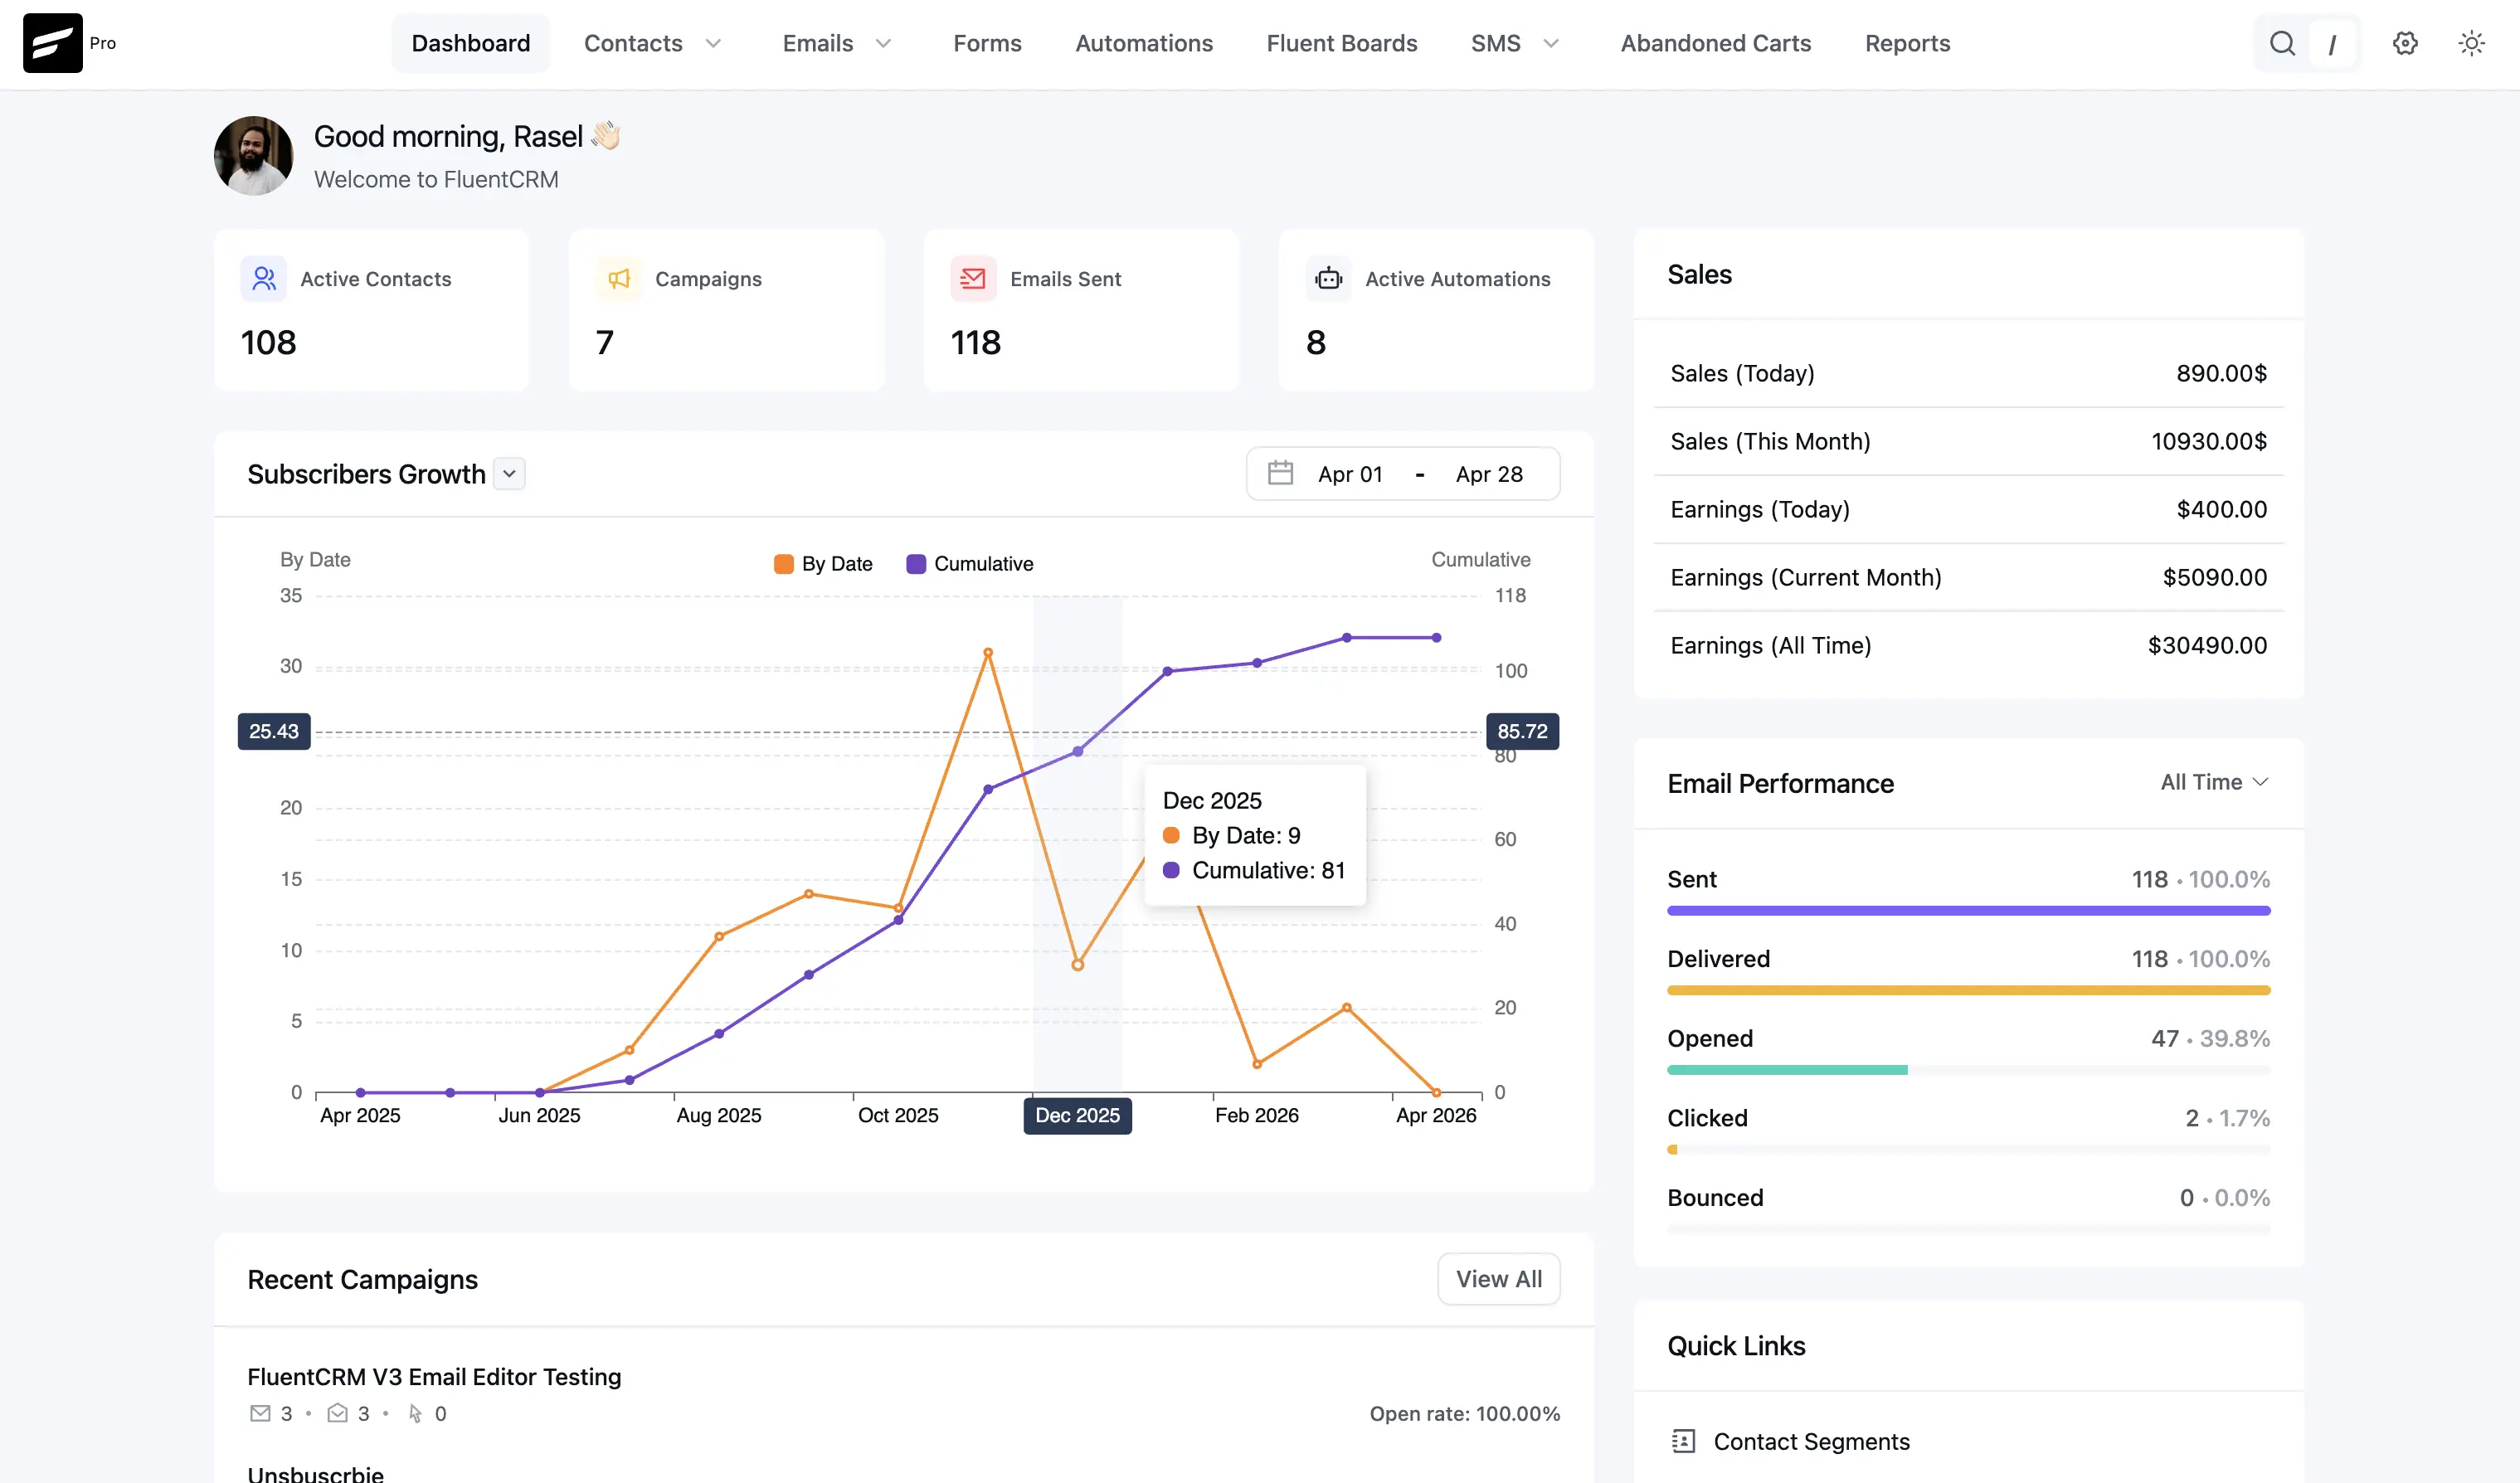
The FluentCRM Dashboard serves as the central command center for your email marketing and customer relationship management activities. It provides a real-time, high-level overview of your marketing health, subscriber growth, and campaign performance.
Overview of the FluentCRM Dashboard
The dashboard is designed to provide actionable insights at a glance, allowing you to monitor the most critical aspects of your marketing funnels without digging through complex menus.
1. Welcome line and key metrics
At the top of the dashboard you’ll see a personalized greeting (for example, Good morning with your name) and a short Welcome to FluentCRM line. Directly under that, four stat cards summarize your current standing:
- Active Contacts: The total number of unique, subscribed individuals currently in your database.
- Campaigns: The total number of broadcast email campaigns you have created.
- Emails Sent: The cumulative number of individual emails delivered to your contacts.
- Active Automations: The number of automated marketing funnels currently “Live” and processing contacts.
2. Subscribers Growth chart
This section charts how your audience grows over time. A date range control in the header (for example, a start–end span within a month) limits the data shown.
- Two series: By Date (typically the orange line) shows sign-ups or activity per day; Cumulative (typically the purple line) shows running total growth. You can use the chart legend to focus on one or both.
- Dual vertical axes: The left axis usually scales daily or per-date values; the right axis scales the cumulative total, so both curves stay readable on one chart.
- Tooltips: Hover a point on the chart to see exact By Date and Cumulative numbers for that period.
3. Right sidebar
The column on the right stacks several widgets.
Sales summary
When your site is connected to a store or revenue tracking, you may see a Sales block with figures such as sales today and this month, plus Earnings for today, the current month, and all time. If you do not use that integration, this block may be hidden or empty.
Email Performance
This widget summarizes deliverability and engagement for a recent window (for example, the last 90 days), often as color-coded progress bars:
- Sent: Total emails sent and share of the total.
- Delivered: Messages accepted by recipients’ mail servers (distinct from “Sent” when some sends do not complete delivery).
- Opened: Average or share opened—useful for subject line and content relevance.
- Clicked: Engagement on links and CTAs in your emails.
- Bounced: Failed deliveries; keeping this low helps protect sender reputation.
Quick Links
Shortcuts for common admin tasks—for example Contact Segments (tags and lists). Depending on your setup, you may also see entries such as Email Sequences, help or video tutorials, and SMTP/Mail settings.
Recent Activity Sections
The lower part of the dashboard surfaces your latest marketing activity.
Recent Campaigns
See your latest broadcast emails with quick stats (such as sent, opened, and clicked counts where shown) and Open rate. Use View All to open the full campaign list.
Recent Contacts
A quick-view list of the latest people to join your list. It shows their name, email address, and current status (for example, Subscribed).
Active Automations
This list highlights automations that are running, such as abandoned-cart flows or triggers when someone joins a list or tag. Use it as a shortcut into the automation builder when you need to adjust a live funnel.