Appearance
Emails Report
The Emails Report in FluentCRM provides a centralized dashboard to analyze the performance of your email marketing efforts across all campaigns and automations. It offers high-level metrics and granular visual data to help you track deliverability and engagement over time.
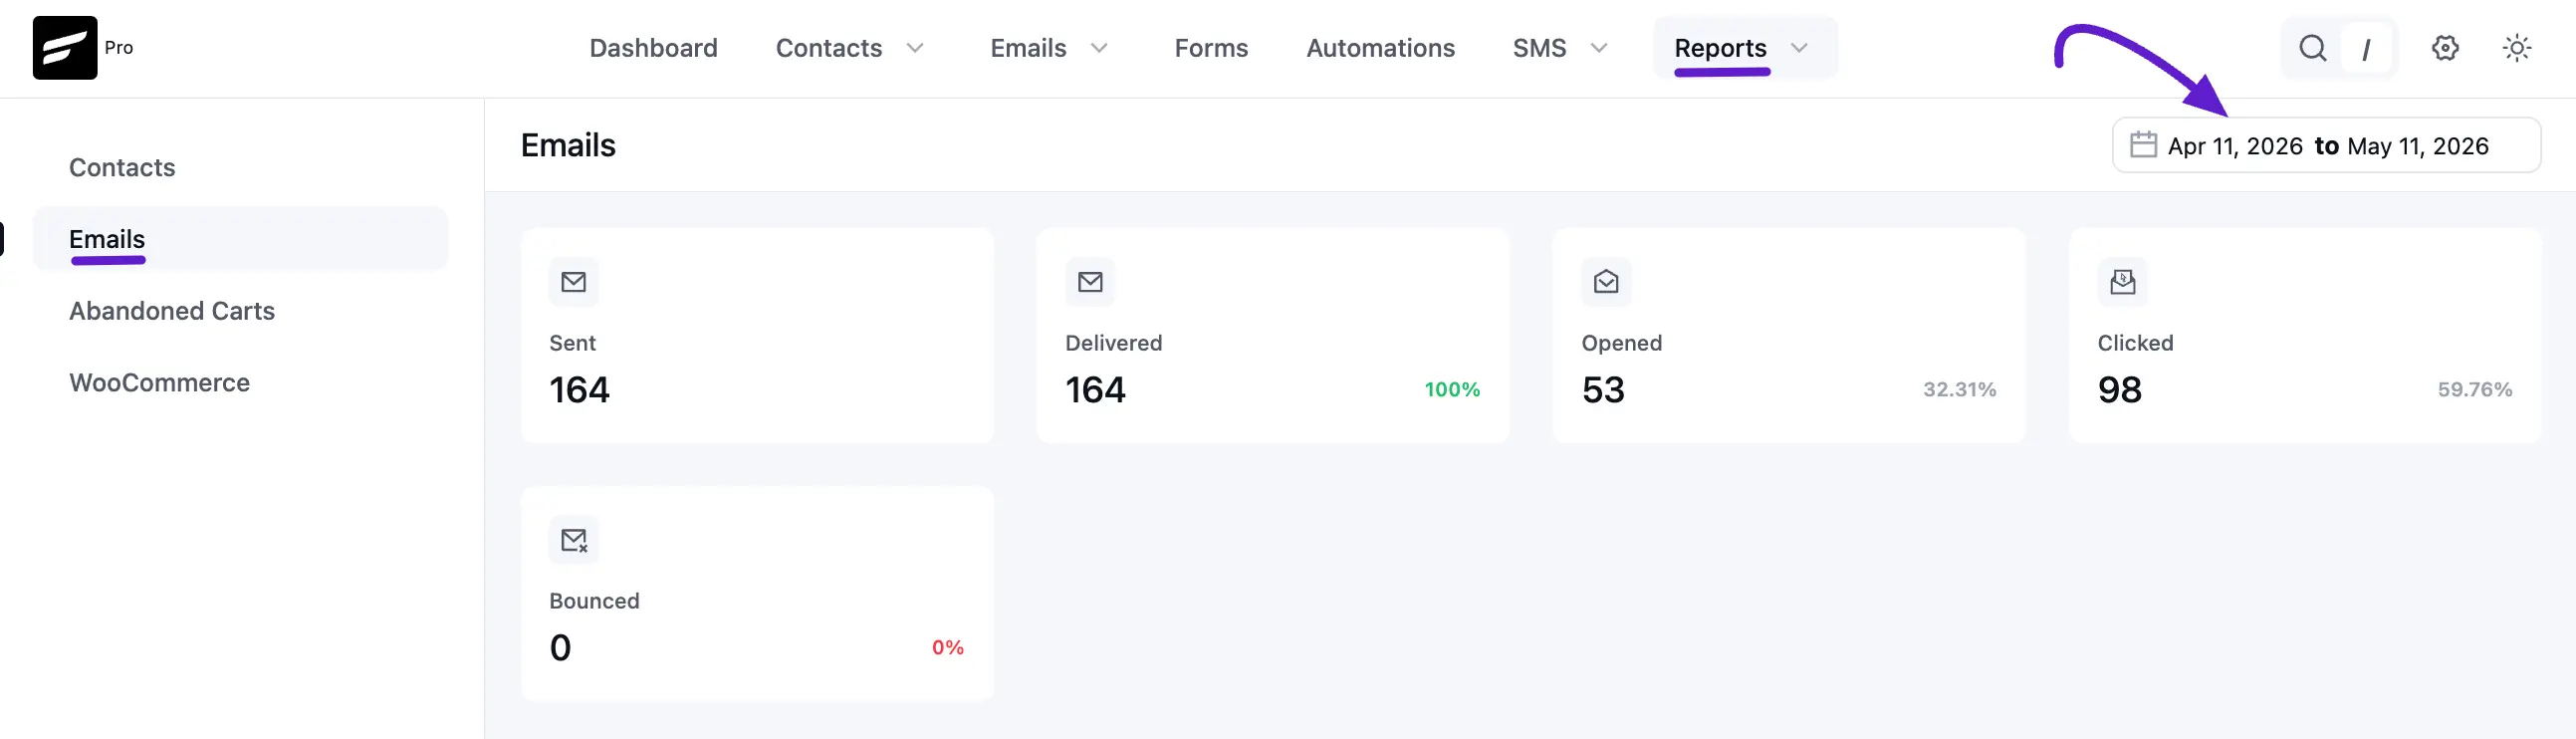
To access this report, navigate to Reports in the top navbar and select Emails from the left sidebar.
1. Key Performance Indicators (KPIs)
At the top of the dashboard, you will find five primary cards that summarize your overall email activity for the selected date range:
- Sent: The total number of emails processed by FluentCRM.
- Delivered: The total number of emails successfully accepted by recipients' email servers (often shown with a percentage to indicate deliverability health).
- Opened: The total number of unique opens across your emails.
- Clicked: The total number of unique clicks on links within your emails.
- Bounced: The number of emails that failed to reach the recipient (usually due to invalid addresses or server issues).
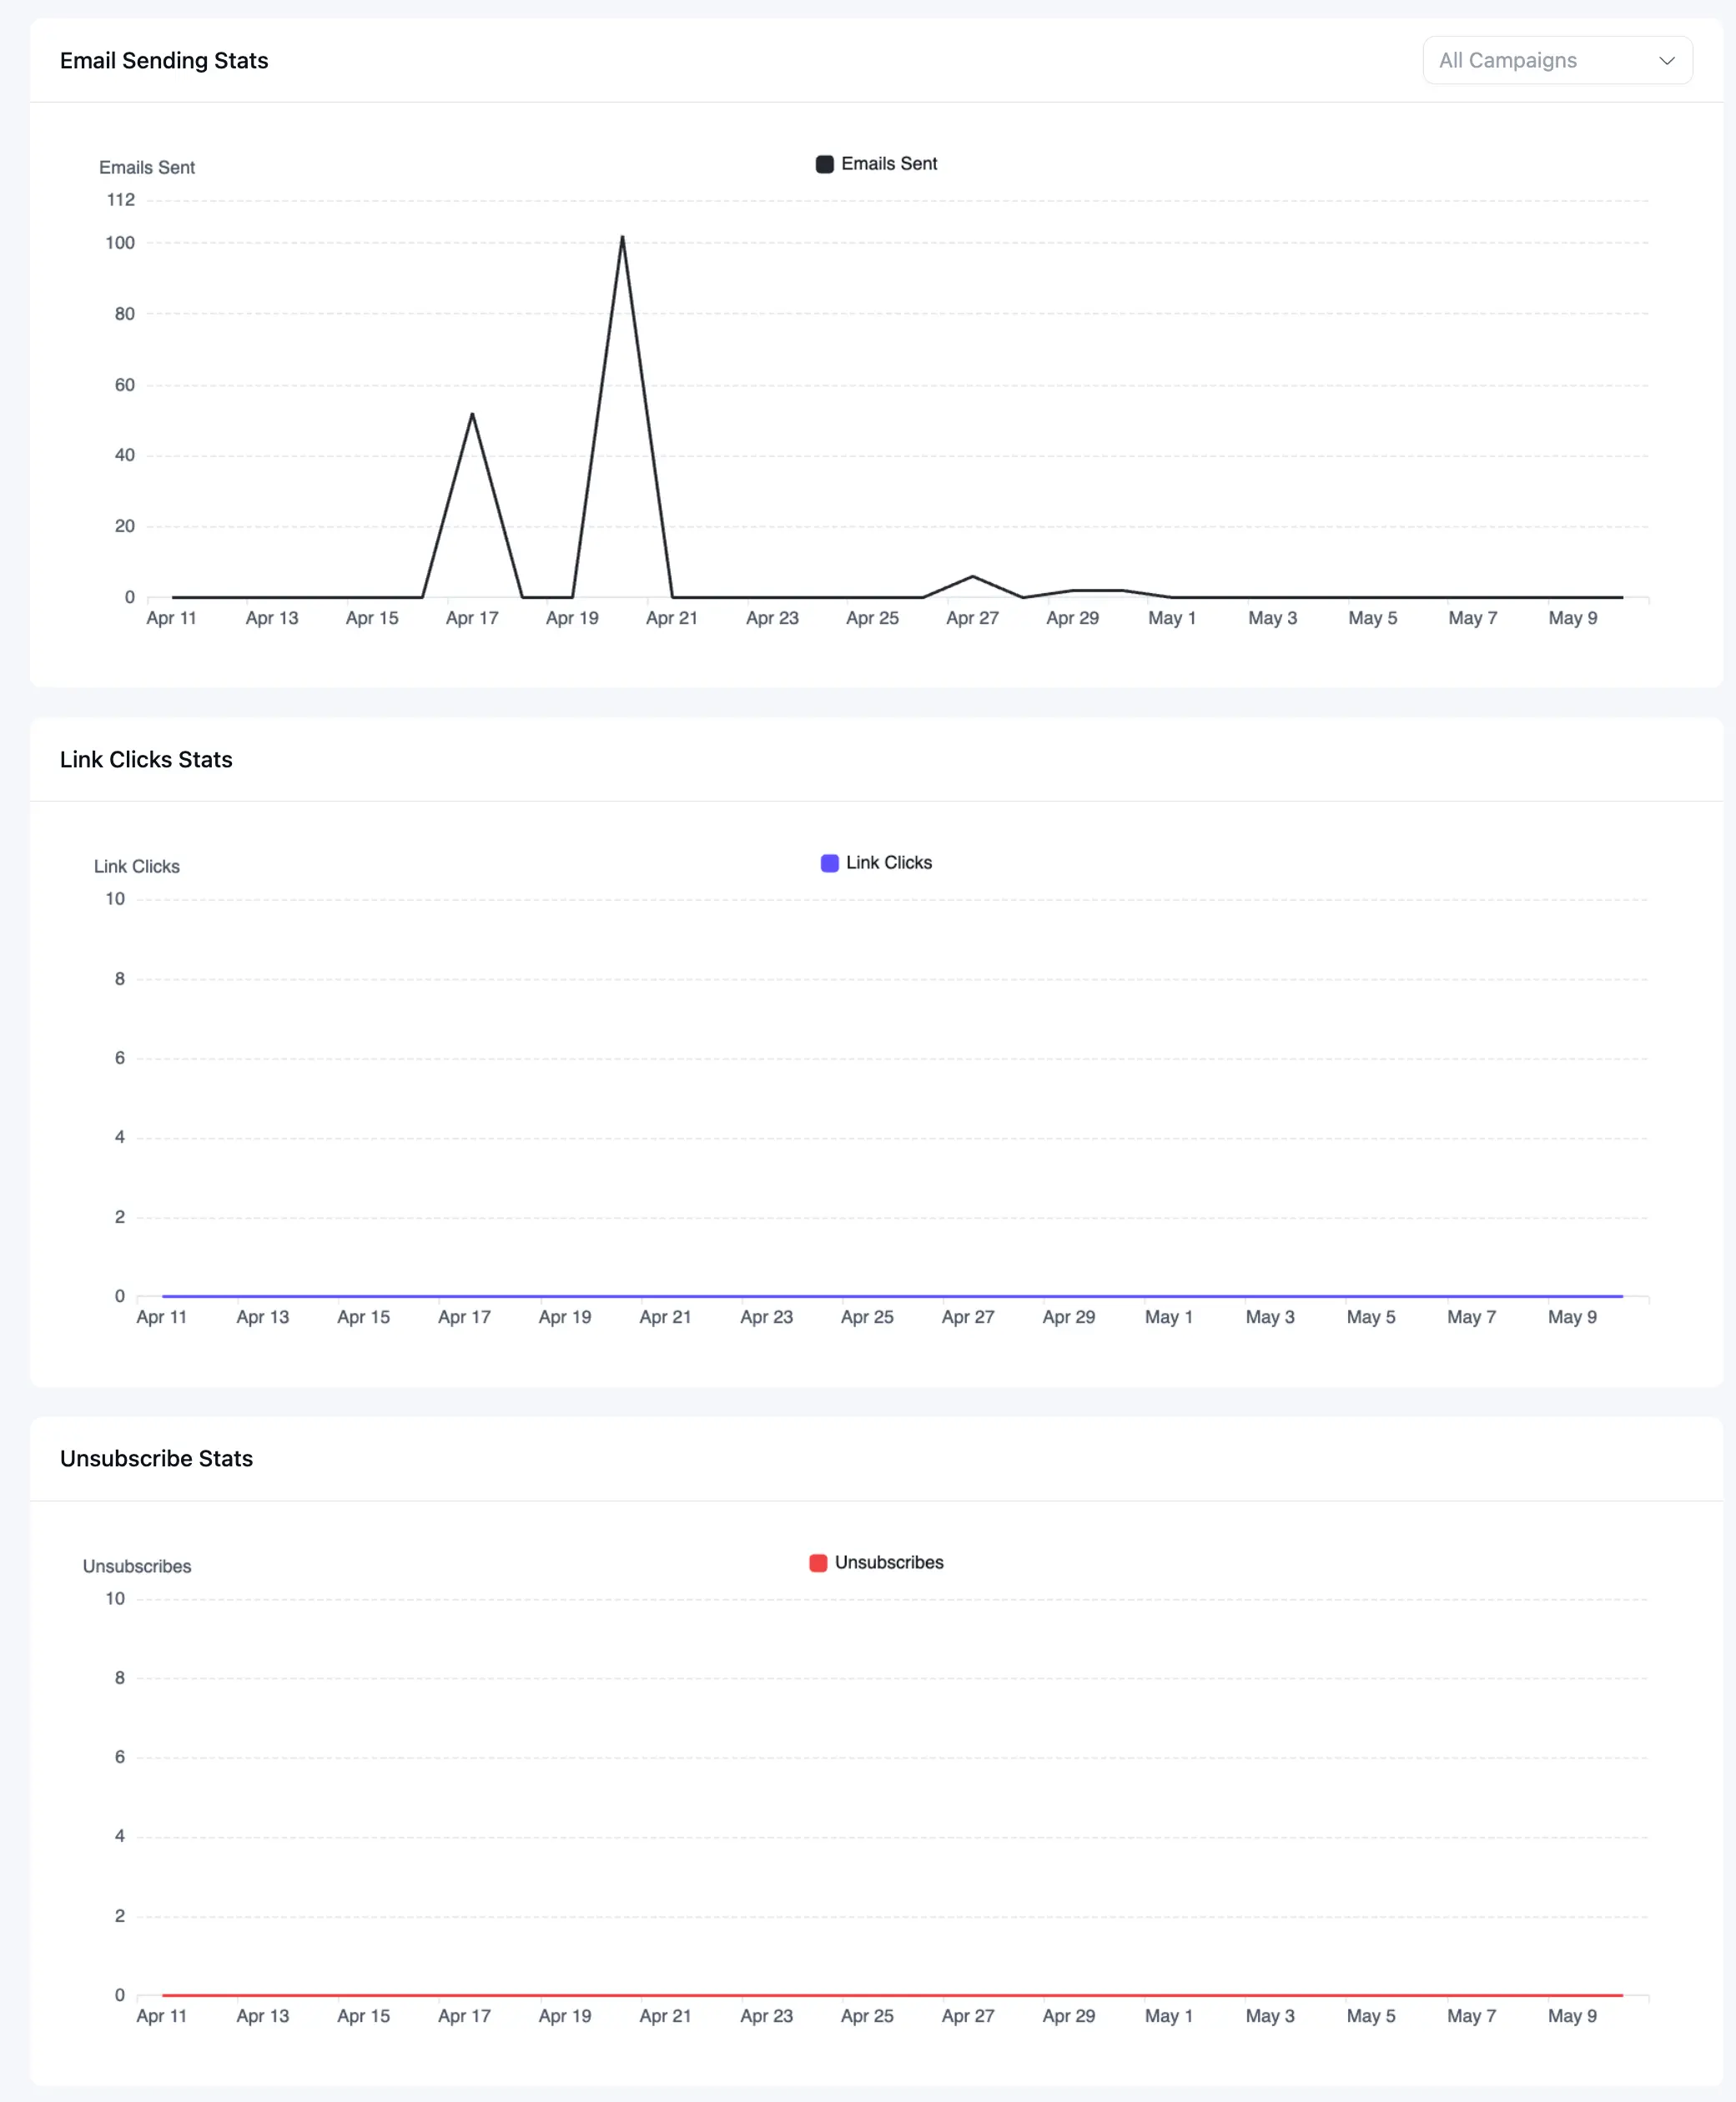
2. Performance Charts
The dashboard uses interactive line graphs to visualize trends and help you identify high-performance periods.
- Email Sending Stats: This chart tracks the volume of Emails Sent on specific days. Spikes in this graph typically correlate with major campaign launches or high-traffic automation triggers.
- Link Click Stats: A dedicated graph to monitor subscriber engagement through Link Clicks. This helps you see if specific content drove more traffic to your site on certain days.
- Unsubscribe Stats: This line graph monitors Unsubscribes. Monitoring this daily helps you ensure your content remains relevant and that your sending frequency isn't overwhelming your audience.
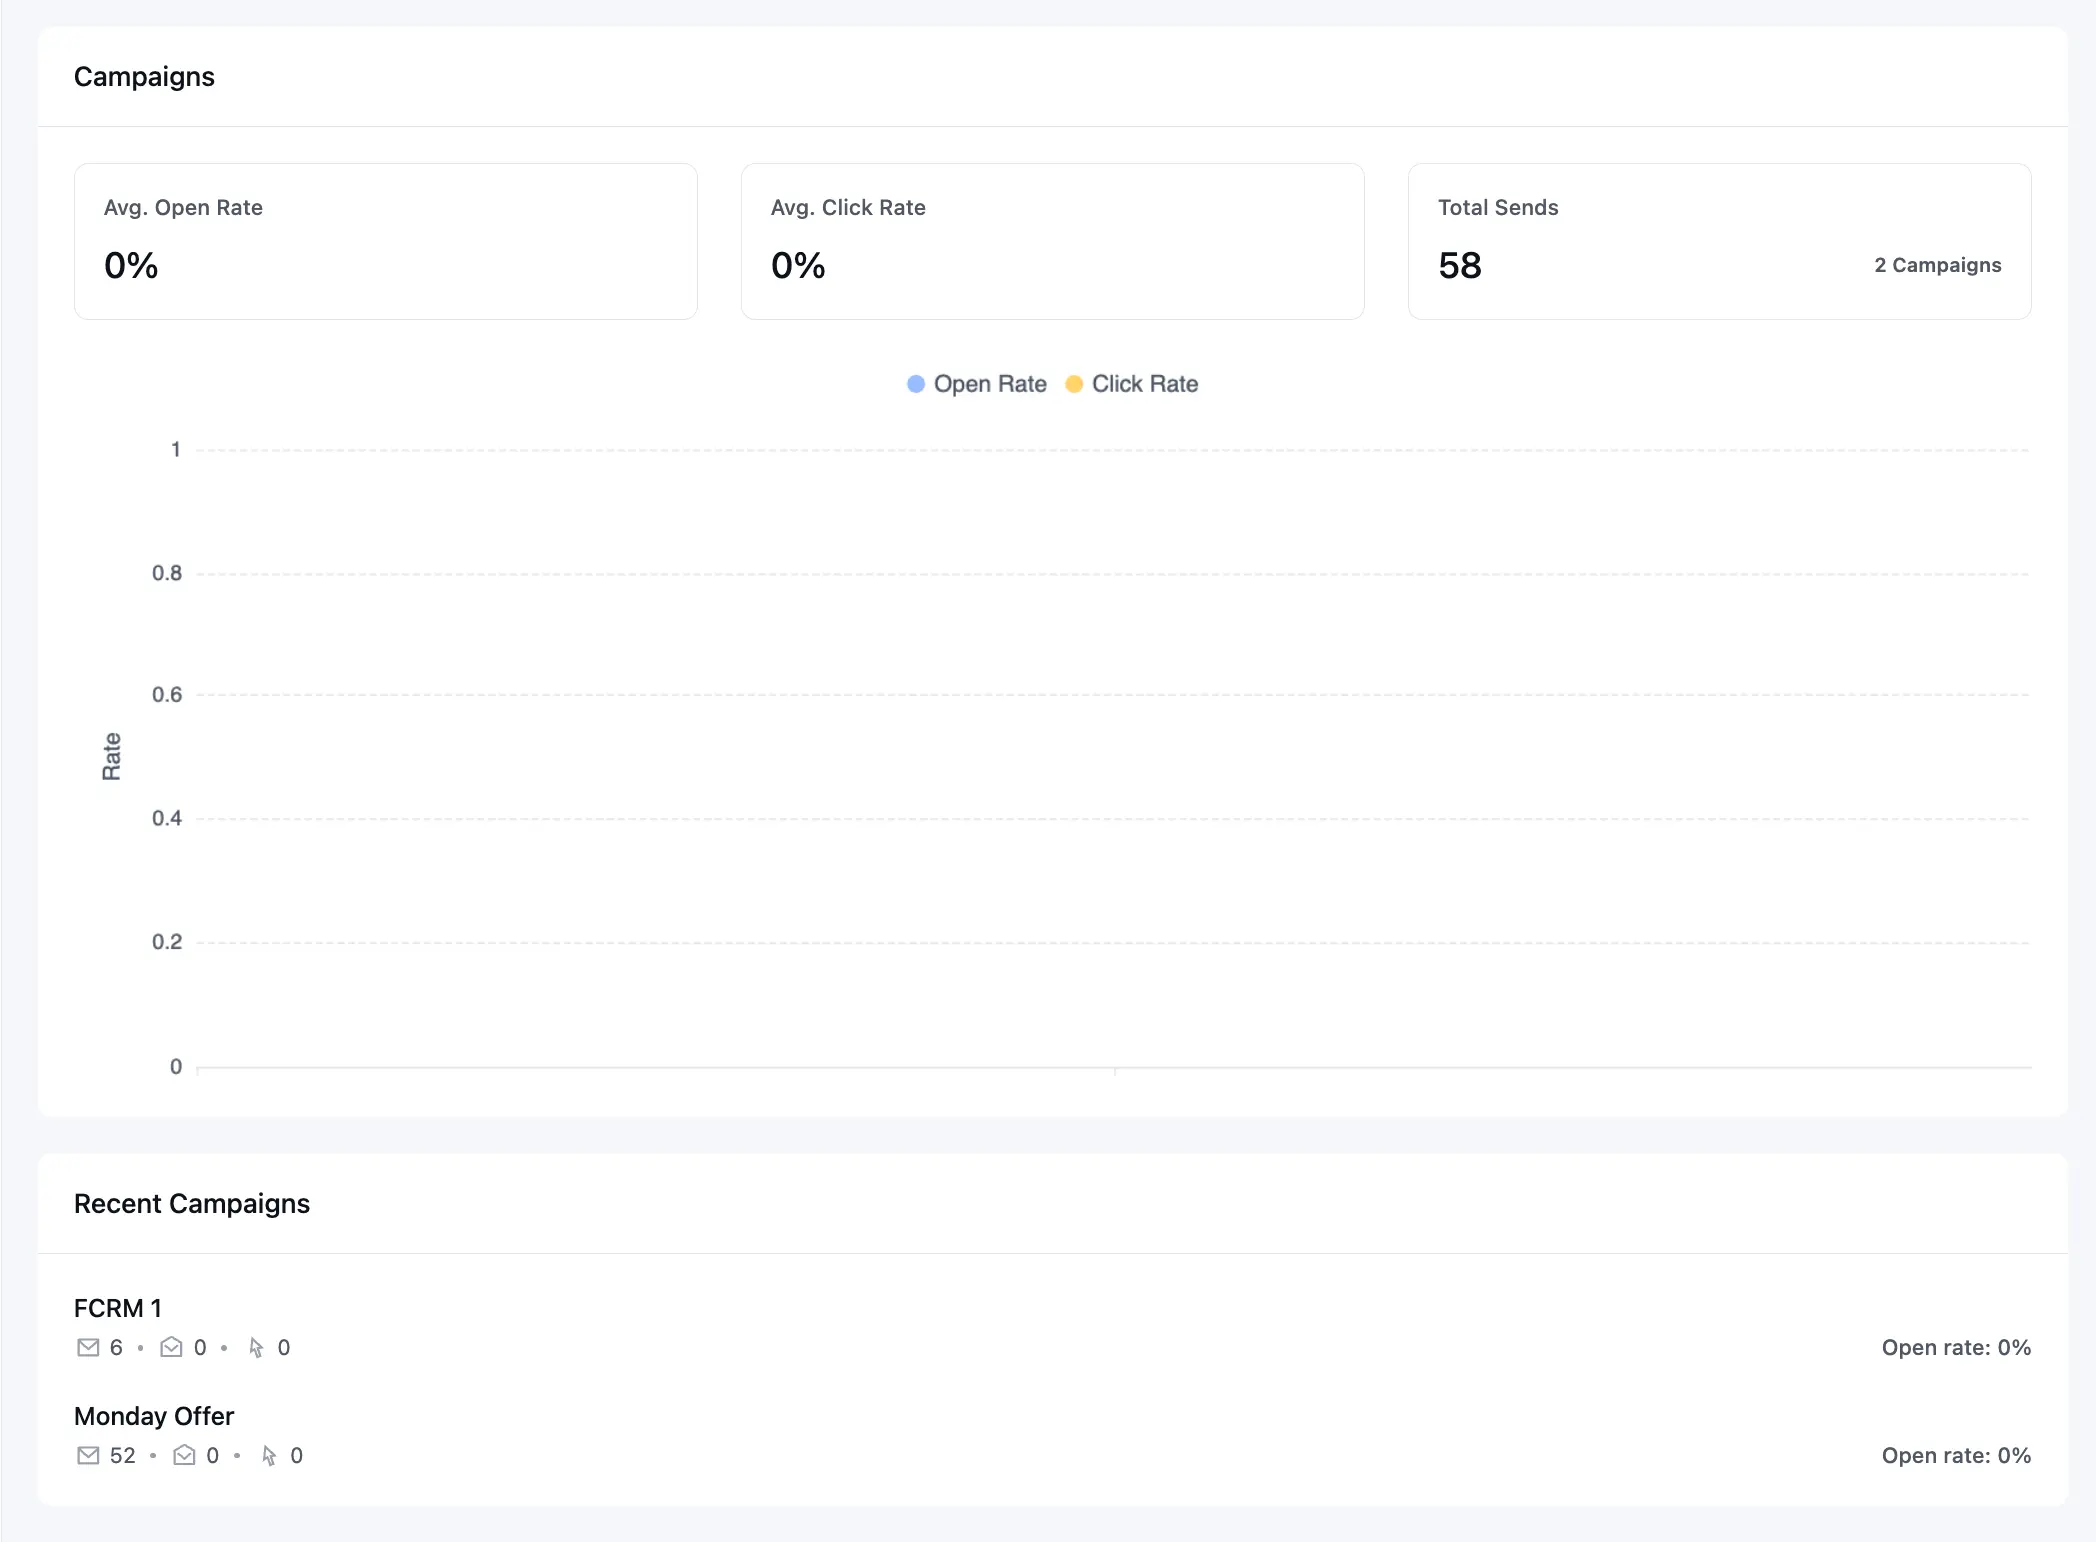
3. Campaign Engagement Analytics
This section provides an total view of your campaign success rates:
- Avg. Open Rate: The percentage of sent emails that were opened.
- Avg. Click Rate: The percentage of recipients who clicked a link.
- Total Sends: The sum of emails sent across the campaigns included in this specific view.
- Comparison Graph: A visual overlay comparing Open Rate (Blue) vs. Click Rate (Yellow) to help you analyze the gap between subject line interest and content engagement.
4. Recent Campaigns
The bottom section of the report lists your most recently executed campaigns. This quick-view table allows you to see the individual Open Rate and basic stats for each broadcast at a glance without leaving the main reporting page.
Pro Tips for Email Reporting
- Date Filtering: Use the date picker in the top right corner to filter data for specific periods (e.g., Last 30 days) to see how your metrics evolve monthly.
- Campaign Filtering: You can use the All Campaigns dropdown in the Sending Stats section to isolate the data for a single campaign or view the aggregate of all activity.
- Monitor Bounces: Always aim for a Delivered rate above 99%. If your Bounced rate increases, it may be time for a list hygiene session to remove inactive or invalid contacts.