Appearance
EDD - Advanced Reports
FluentCRM provides an integrated reporting suite for Easy Digital Downloads (EDD), offering digital product creators deep insights into their sales performance, customer acquisition, and product trends. This dashboard connects your store's financial data directly with your CRM insights.
To access these reports, navigate to the Reports dropdown in the top navbar and select EDD from the left sidebar.
NOTE
Ensure your EDD data is properly synced with FluentCRM. You can learn more about the EDD integration with FluentCRM.
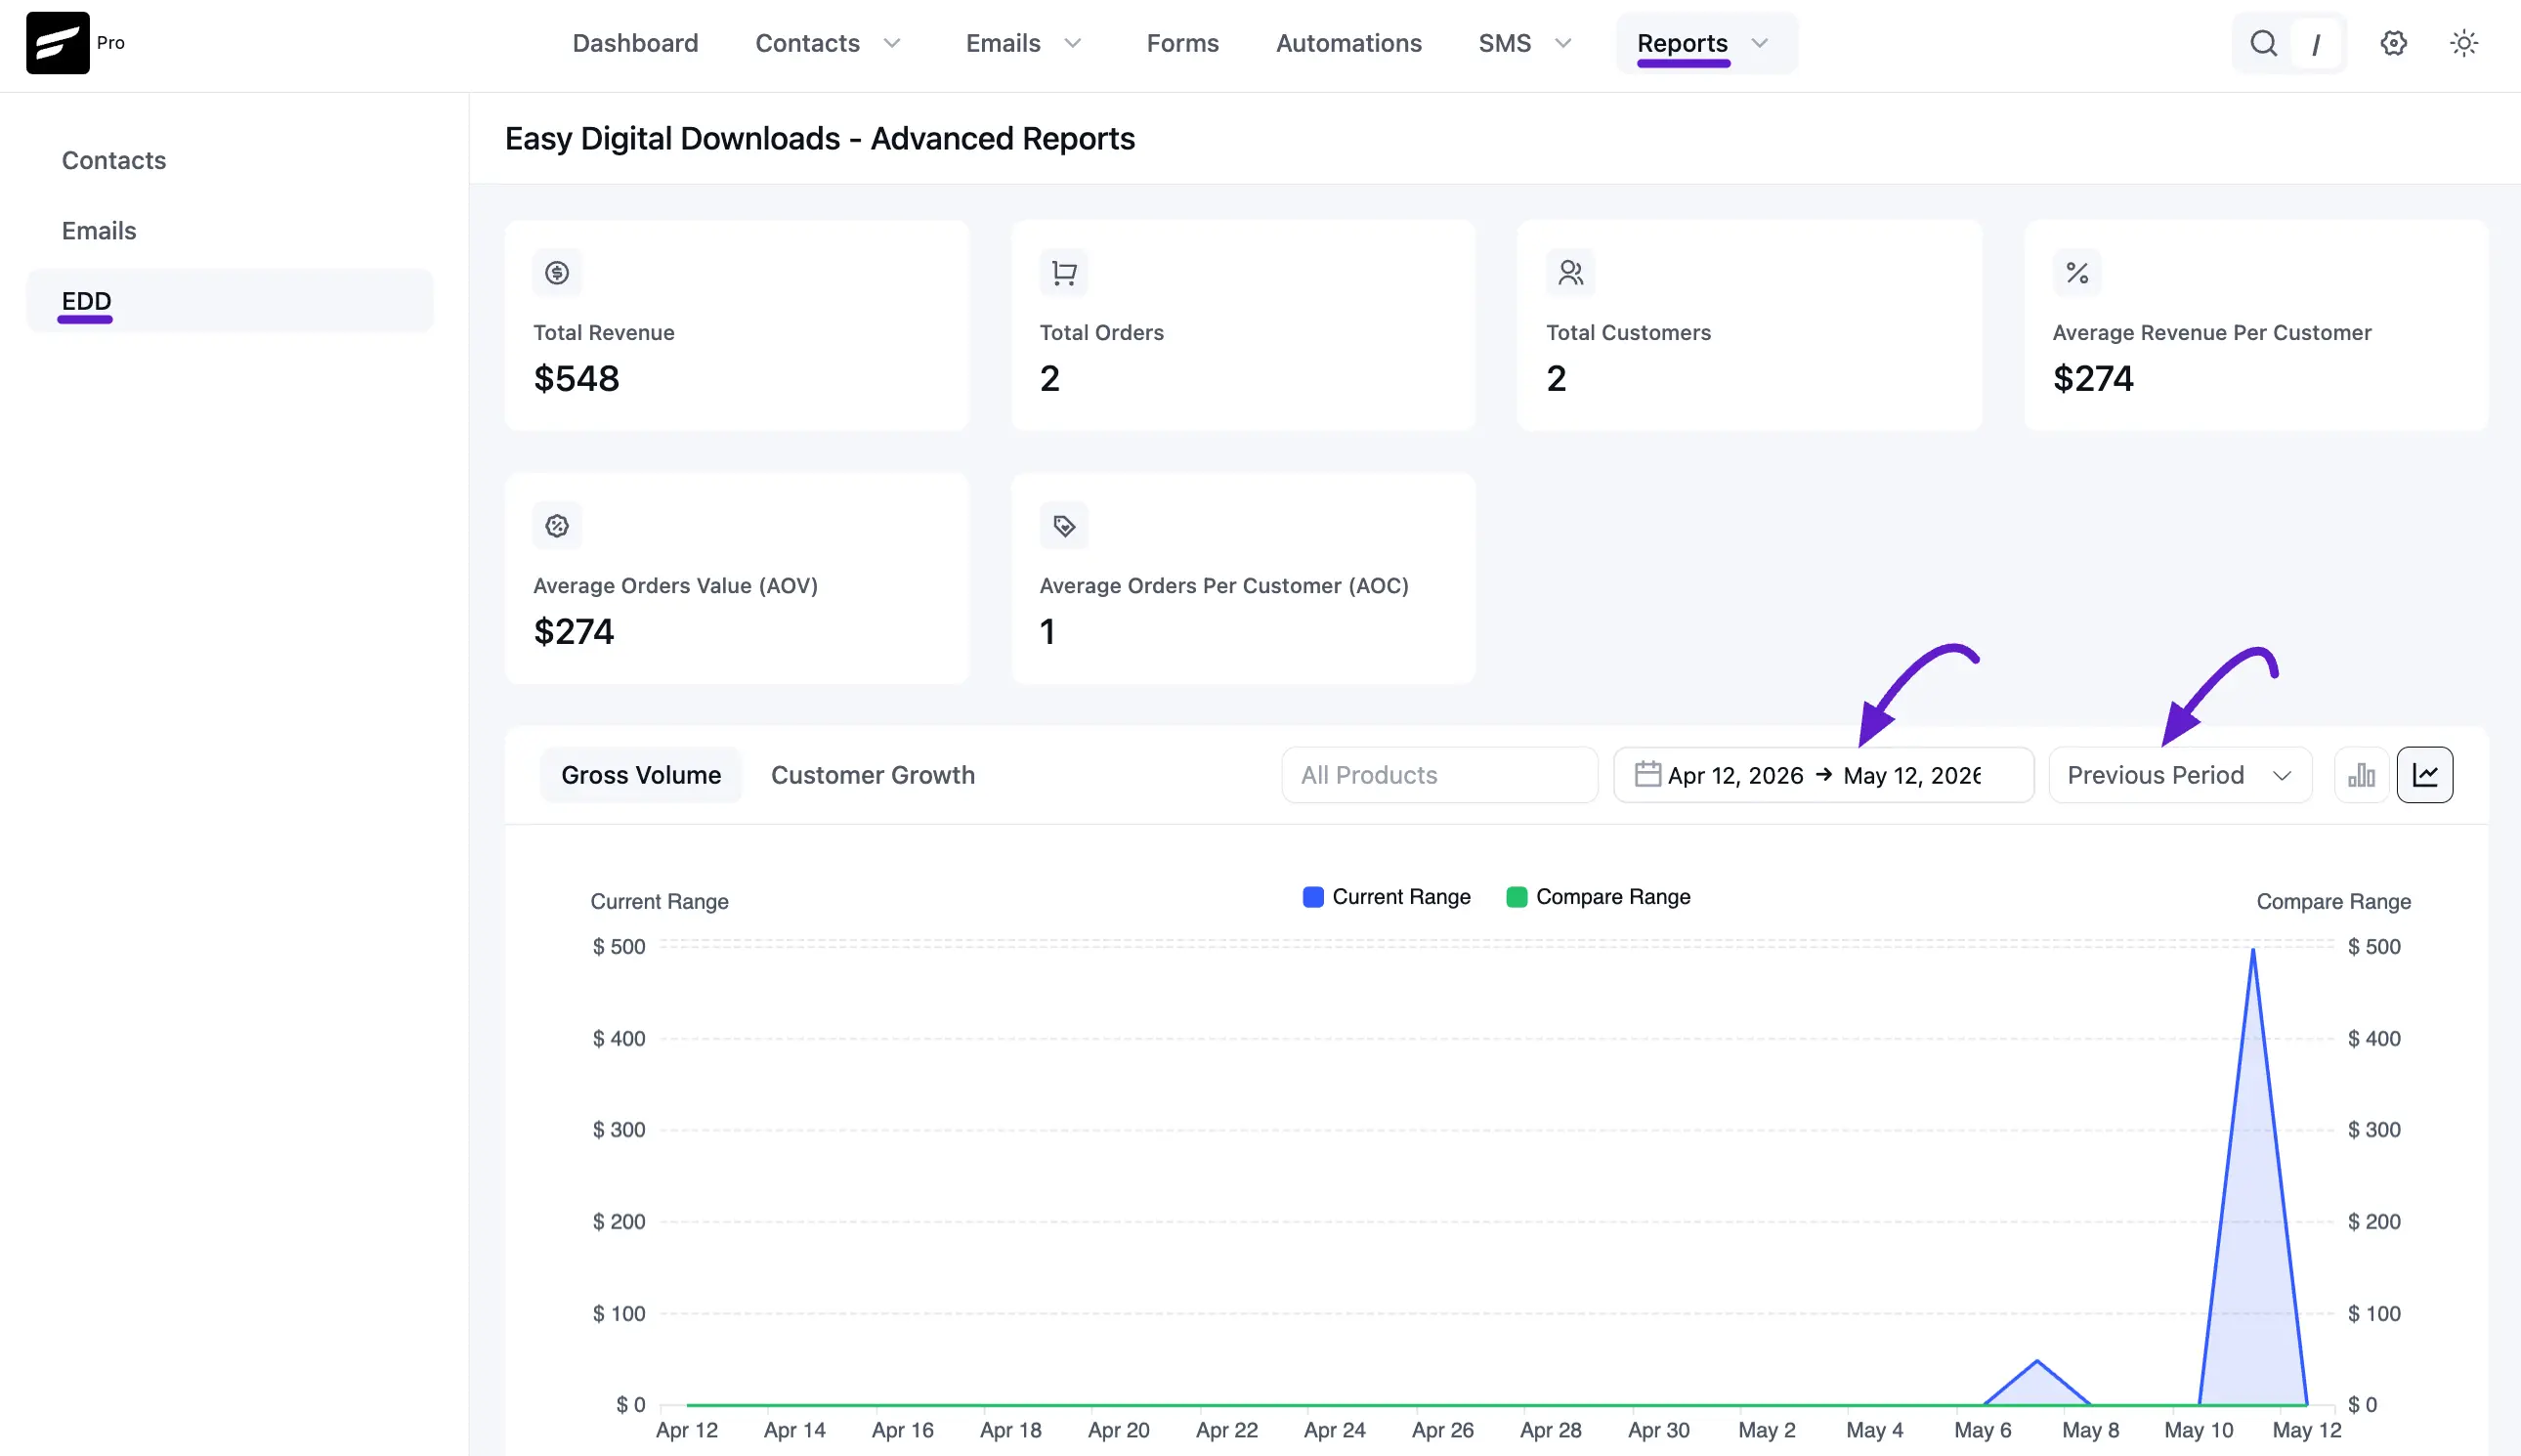
1. Sales Performance Overview
The top section provides an immediate snapshot of your digital store’s health through six key metrics:
- Total Revenue: The aggregate income from all successful digital downloads.
- Total Orders: The total number of completed transactions.
- Total Customers: The number of unique buyers in your database.
- Average Revenue Per Customer: The average lifetime value (LTV) of your digital consumers.
- Average Order Value (AOV): The average amount spent per transaction.
- Average Orders Per Customer (AOC): Indicates the frequency of repeat purchases.
2. Visual Growth & Volume Charts
Track your store’s progress using the easy-to-use chart section:
- Gross Volume & Customer Growth: Toggle between these views to see daily revenue spikes or new user acquisition rates.
- Comparison Mode: Compare the Current Range (Blue) against a Compare Range (Green) from a previous period to measure growth.
- Filtering: Use the dropdowns to filter by specific dates or isolate the performance of a single digital product.
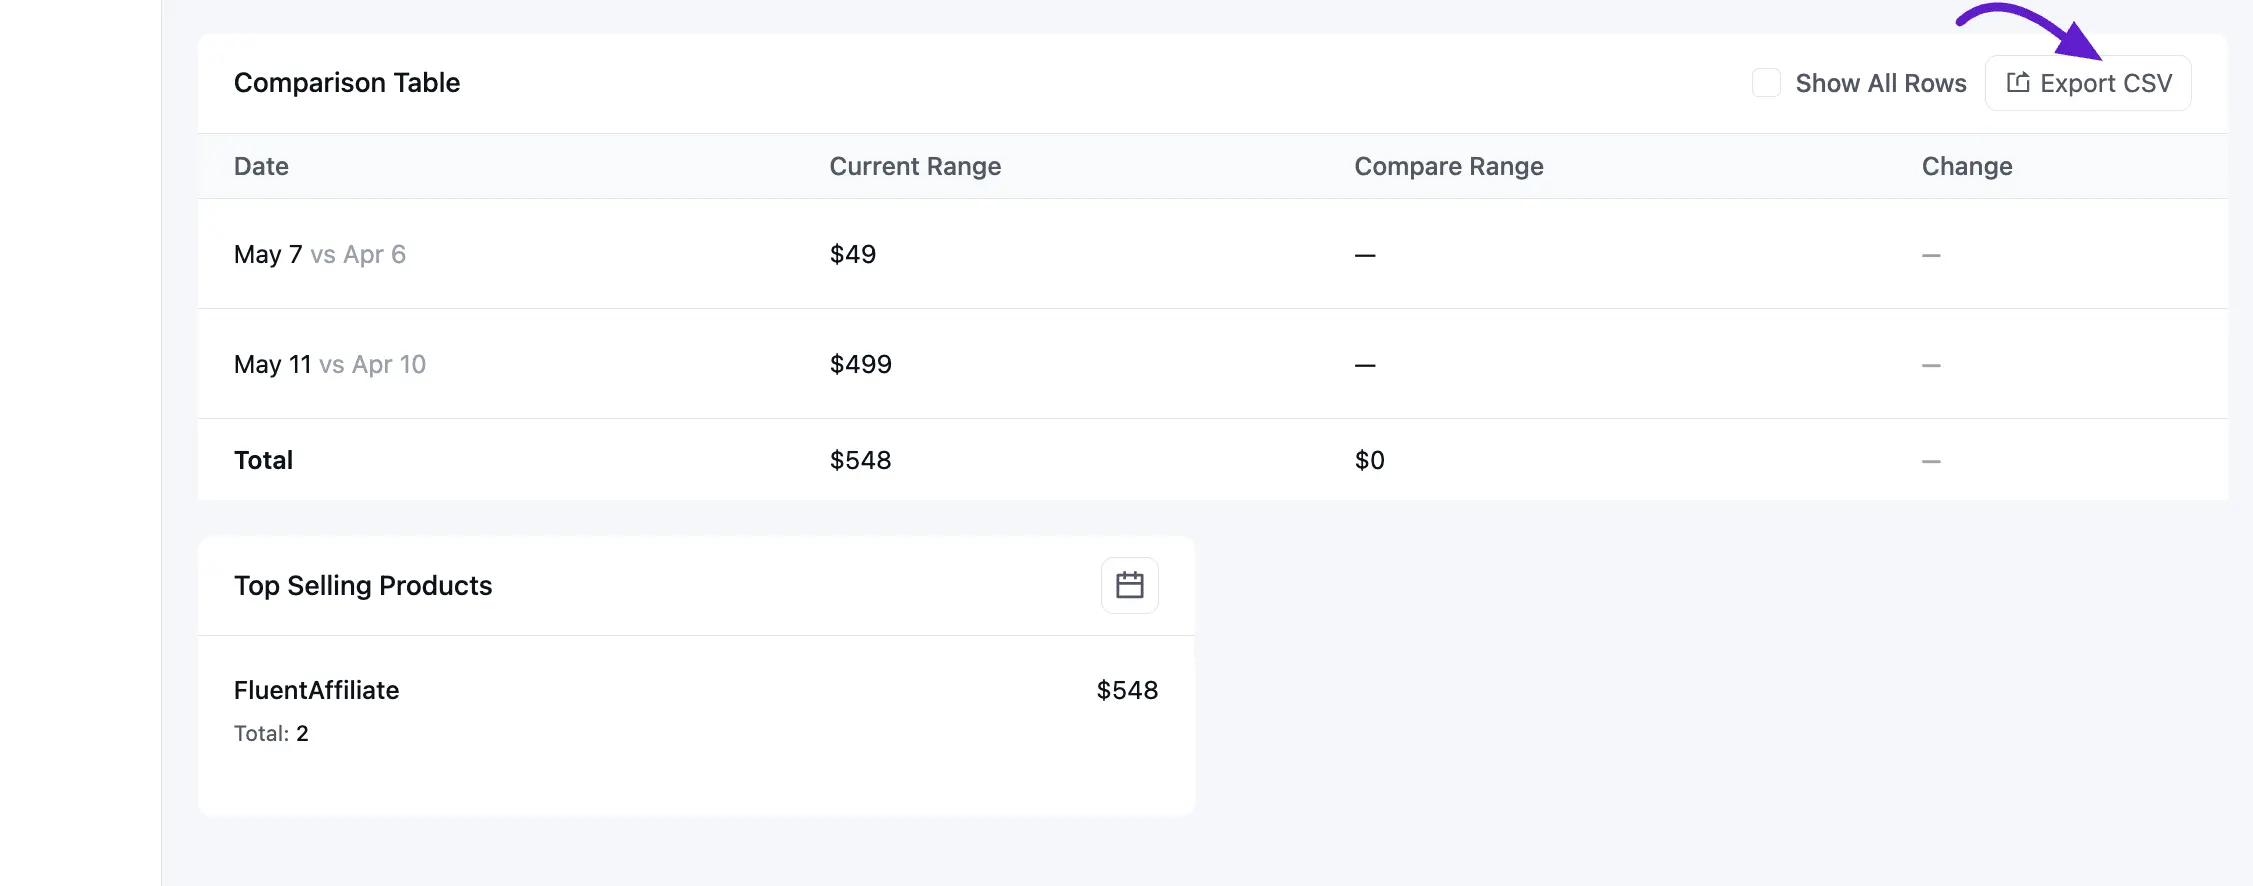
3. Comparison Table
The Comparison Table breaks down your performance day-by-day:
- Trend Tracking: Compare current daily totals against the same day in a previous period.
- Growth Calculation: Monitor the percentage change to see if your marketing efforts are increasing sales.
- Export Capability: Click Export CSV to download the data for external accounting or deeper analysis.
4. Top Selling Products
Identify your most popular digital assets at the bottom of the dashboard:
- Product Insights: View which downloads are driving the most revenue (e.g., FluentAffiliate).
- Sales Volume: See the total number of times each product has been purchased. This helps you identify which products are prime candidates for featured email sequences or upsell automations.